

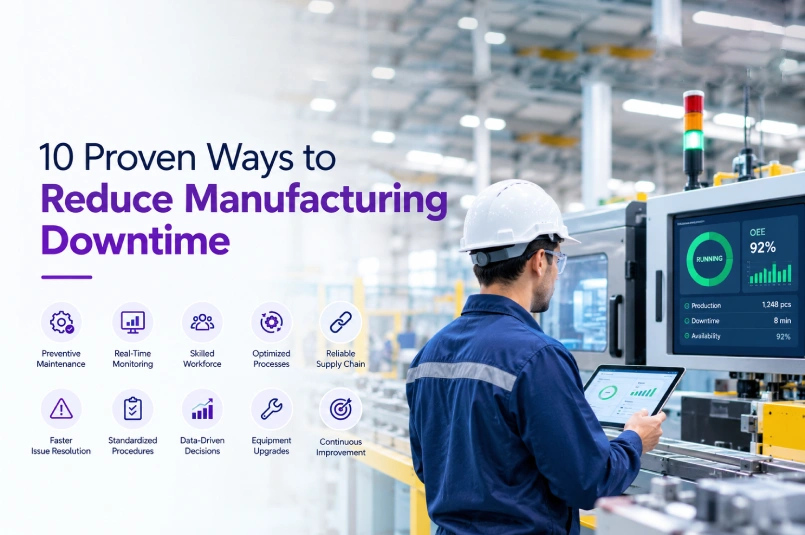
Unplanned downtime is one of the most expensive problems in manufacturing, and one of the most fixable. Most facilities do not have a single dramatic cause of lost production time. Instead, downtime accumulates from dozens of small, recurring issues that never get tracked consistently enough to solve for good.
Below are ten proven approaches manufacturers use to reduce downtime, drawing on Andon alerting, OEE tracking, and machine monitoring data to turn scattered problems into a measurable improvement plan.
1. Track Downtime Reasons, Not Just Downtime Minutes
Knowing that a line was down for 45 minutes tells you almost nothing. Knowing it was down for 45 minutes because of a specific changeover delay, three separate times this month, tells you exactly what to fix. Machine monitoring systems that capture standardized downtime reason codes turn vague totals into an actionable list, ranked by frequency and impact.
2. Implement Real-Time Andon Alerts
The longer it takes to notice a stoppage, the longer it lasts. Andon systems close that gap by alerting the right people the moment a line stops or a quality issue is flagged, rather than waiting for someone to walk the floor and notice. Facilities that implement Andon alerting typically see meaningful reductions in response time within the first few weeks.
3. Measure OEE Consistently Across Lines
Overall Equipment Effectiveness (OEE) breaks performance into availability, performance, and quality, making it clear whether downtime, slow cycles, or defects are driving losses on a given line. Our OEE Systems overview covers how to set this up without building the calculation by hand in a spreadsheet every week.
4. Standardize Changeover Procedures
Changeovers are one of the most common sources of avoidable downtime, and one of the easiest to improve once they are actually measured. Comparing changeover times across shifts and operators often reveals a wide gap between your fastest and slowest teams, which usually points to a documentation or training fix rather than an equipment problem.
5. Build a Preventive Maintenance Schedule Around Real Usage Data
Preventive maintenance based on a fixed calendar often means servicing equipment too early on some machines and too late on others. Maintenance scheduled around actual run hours and cycle counts, captured automatically through machine monitoring, targets service windows more accurately and catches wear before it causes an unplanned stop.
6. Make Performance Visible on the Floor
Visual Management boards that show real-time production status, current downtime, and daily targets keep problems visible to the whole team, not just to a supervisor reviewing a report after the shift ends. Teams respond faster to issues they can see immediately.
7. Analyze Downtime Patterns by Shift and Operator
Downtime data broken out by shift often reveals patterns that a single combined report hides entirely, such as one shift experiencing significantly more changeover delays or micro-stops than another. This is usually a training or process gap rather than an equipment issue, and it is only visible once the data is segmented.
8. Reduce Micro-Stops Through Root Cause Tracking
Micro-stops, the short interruptions that last seconds to a couple of minutes, rarely get reported individually but add up to significant lost time over a shift. Automated machine monitoring captures these consistently, where manual logging almost always misses them.
9. Connect Quality Issues to Downtime Data
Quality problems and downtime are often more connected than they first appear. A line generating scrap may also be experiencing more micro-stops or slower cycle times from the same underlying equipment issue. Tracking both together, rather than in separate systems, makes the connection visible.
10. Review Downtime Trends Monthly, Not Just During a Crisis
Many facilities only dig into downtime data after a serious production miss. Reviewing OEE and downtime trends on a regular monthly cadence, even when performance looks fine, catches slow drifts before they become the next crisis.
Building a Downtime Reduction Culture, Not Just a Tool Rollout
None of the ten approaches above work as a one-time project. The facilities that see lasting downtime reductions treat the data as part of how the team operates day to day, not as a dashboard that gets checked once a quarter. That usually means a short daily or weekly review where supervisors look at the top downtime reasons from the prior period and assign an owner to the biggest one, rather than letting the same category reappear month after month without action.
It also means giving operators a reason to log downtime reasons accurately in the first place. If the data disappears into a report nobody discusses, logging quality drifts over time. Facilities that close the loop, showing the floor what changed as a direct result of the data they captured, tend to see both better logging habits and steadier downtime improvement, because the connection between effort and outcome is visible rather than assumed.
Frequently Asked Questions
What is the biggest cause of unplanned downtime in manufacturing?
It varies by facility, but changeover delays, minor equipment stops, and unplanned maintenance are consistently among the most common causes. The specific mix is different for every plant, which is why tracking downtime reasons by category matters more than following generic industry averages.
How much does downtime typically cost manufacturers?
Costs vary widely depending on the industry and line, but even a few percentage points of unplanned downtime can represent a significant share of total production capacity over a year. Tracking OEE consistently is the most reliable way to quantify the actual cost for a specific facility.
Can Andon systems really reduce downtime, or just alert to it faster?
Both. Faster alerting reduces how long an issue goes unnoticed, which directly shortens downtime duration. Over time, the data Andon systems collect on trigger frequency and response time also highlights recurring issues worth fixing at the root cause.
Do I need new equipment to start tracking downtime accurately?
Not necessarily. Many machine monitoring systems connect to existing PLCs and controllers, and lightweight sensors can be added to older or manual equipment that lacks a digital connection point.
How quickly can a manufacturer expect to see downtime improvements?
Many facilities see measurable reductions in response time within the first few weeks of implementing real-time Andon alerts. Broader OEE improvements from process changes typically show up over two to three months as recurring issues are identified and addressed.
How do we keep downtime tracking accurate once the initial rollout excitement fades?
Close the feedback loop. When operators see that the downtime reasons they log actually lead to visible changes, whether that is a maintenance fix or a process adjustment, logging accuracy tends to hold up far better than when the data goes into a report no one discusses.
Want to see how connected monitoring, Andon, and OEE tracking can reduce downtime on your floor? Schedule a conversation with the VersaCall team, or explore our case studies for real results.


